Results evaluation#
Visualization#
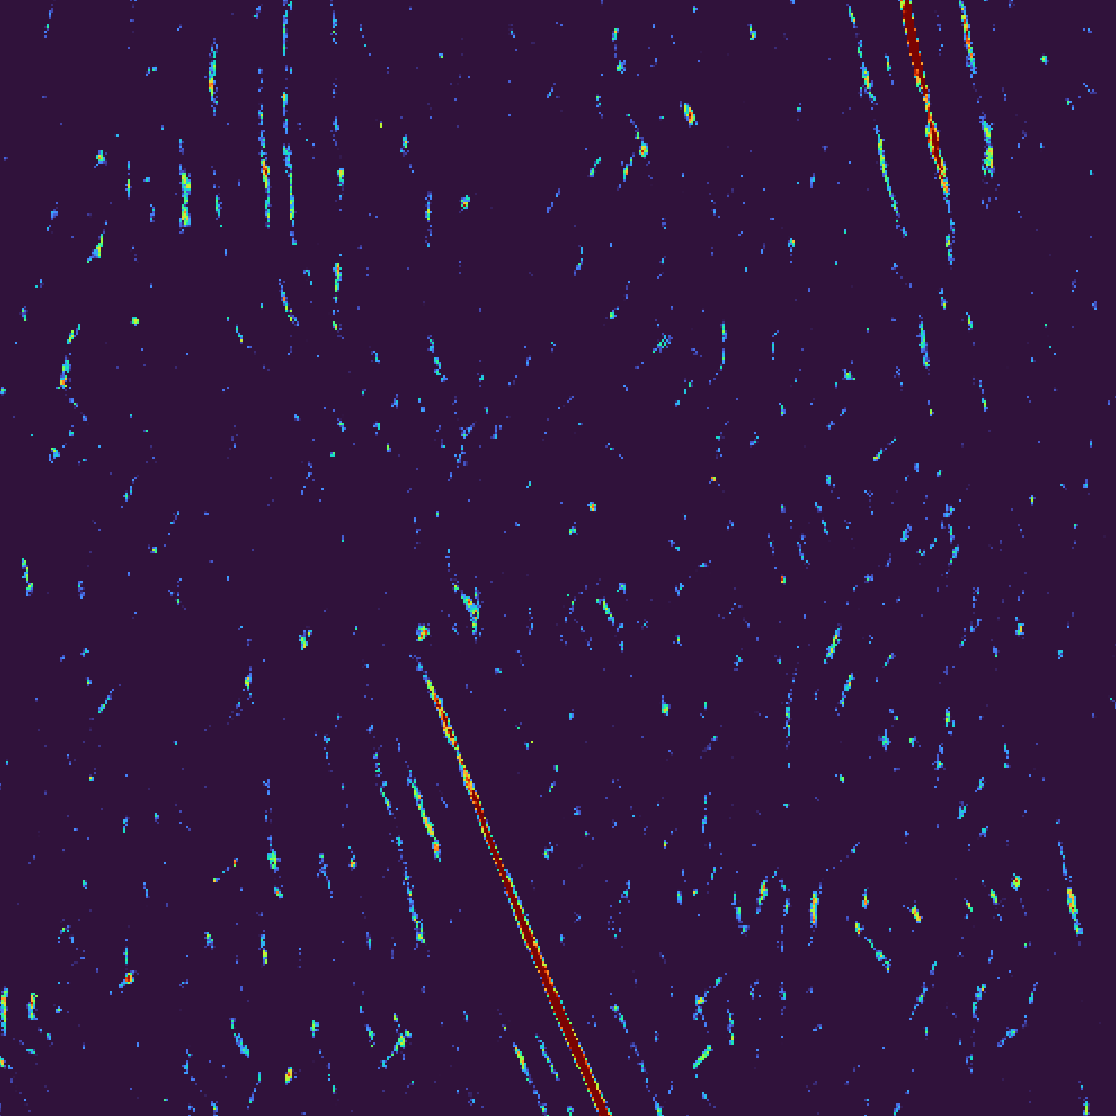
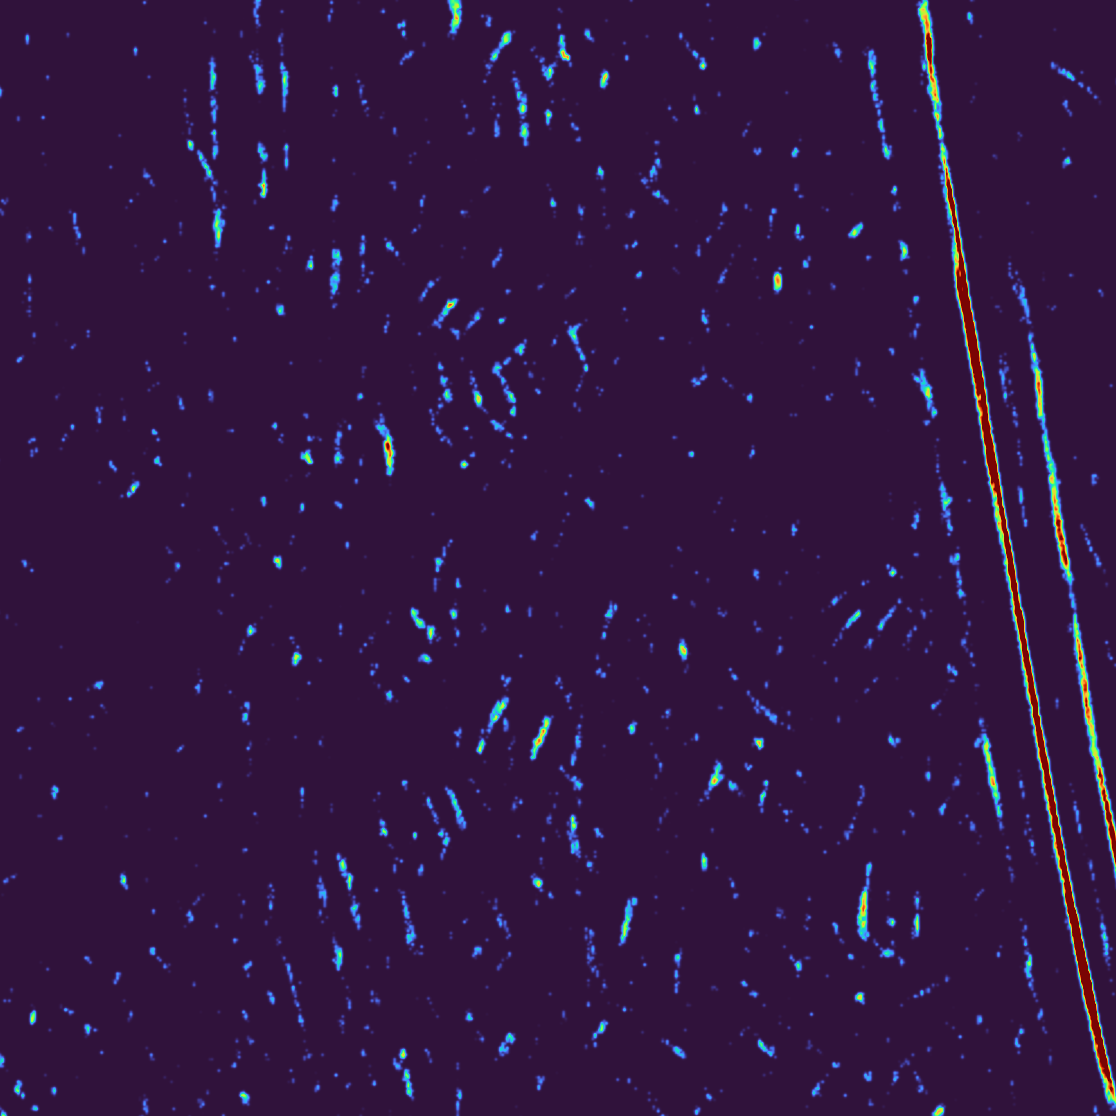
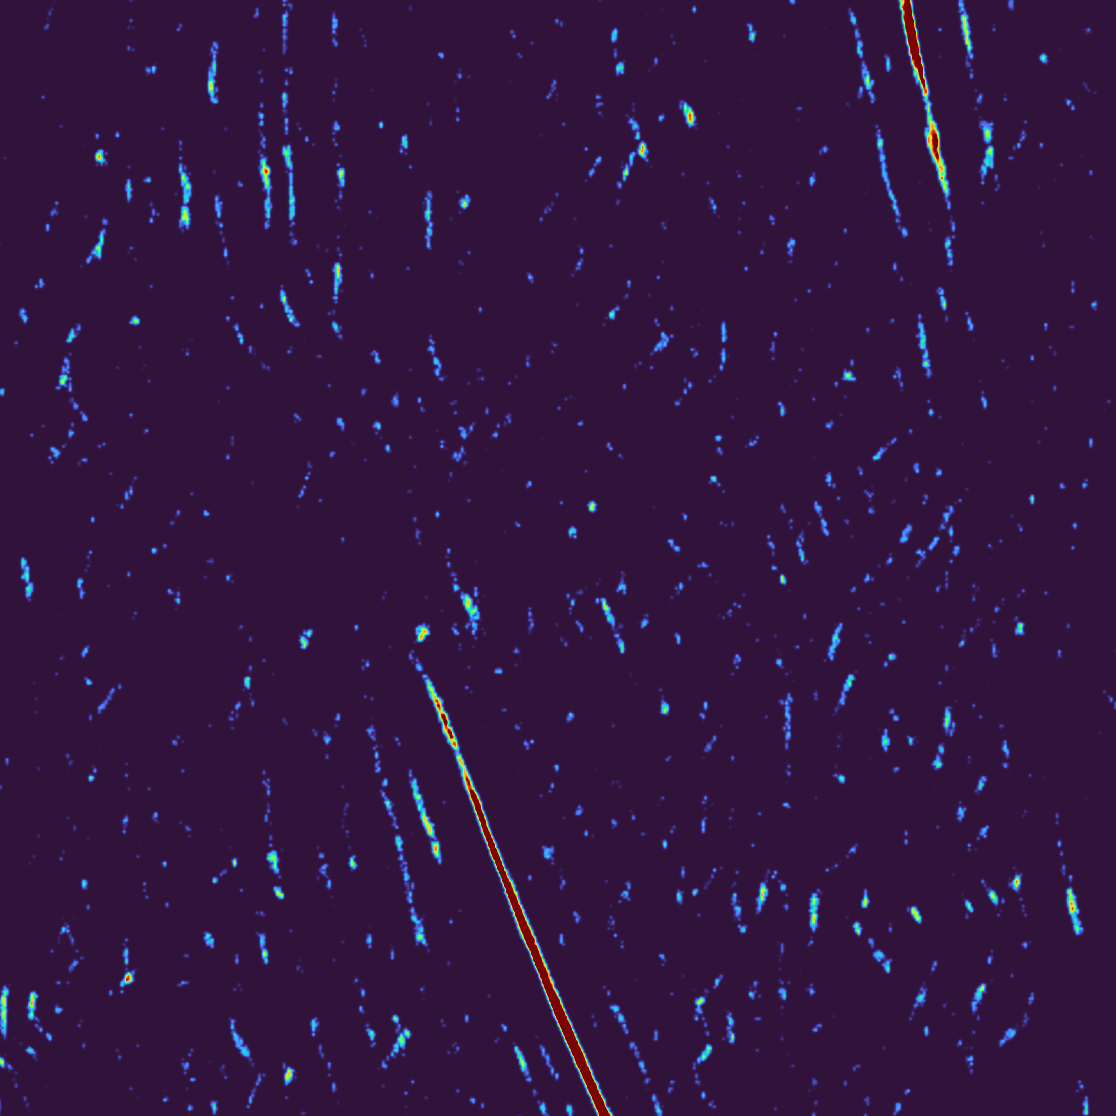
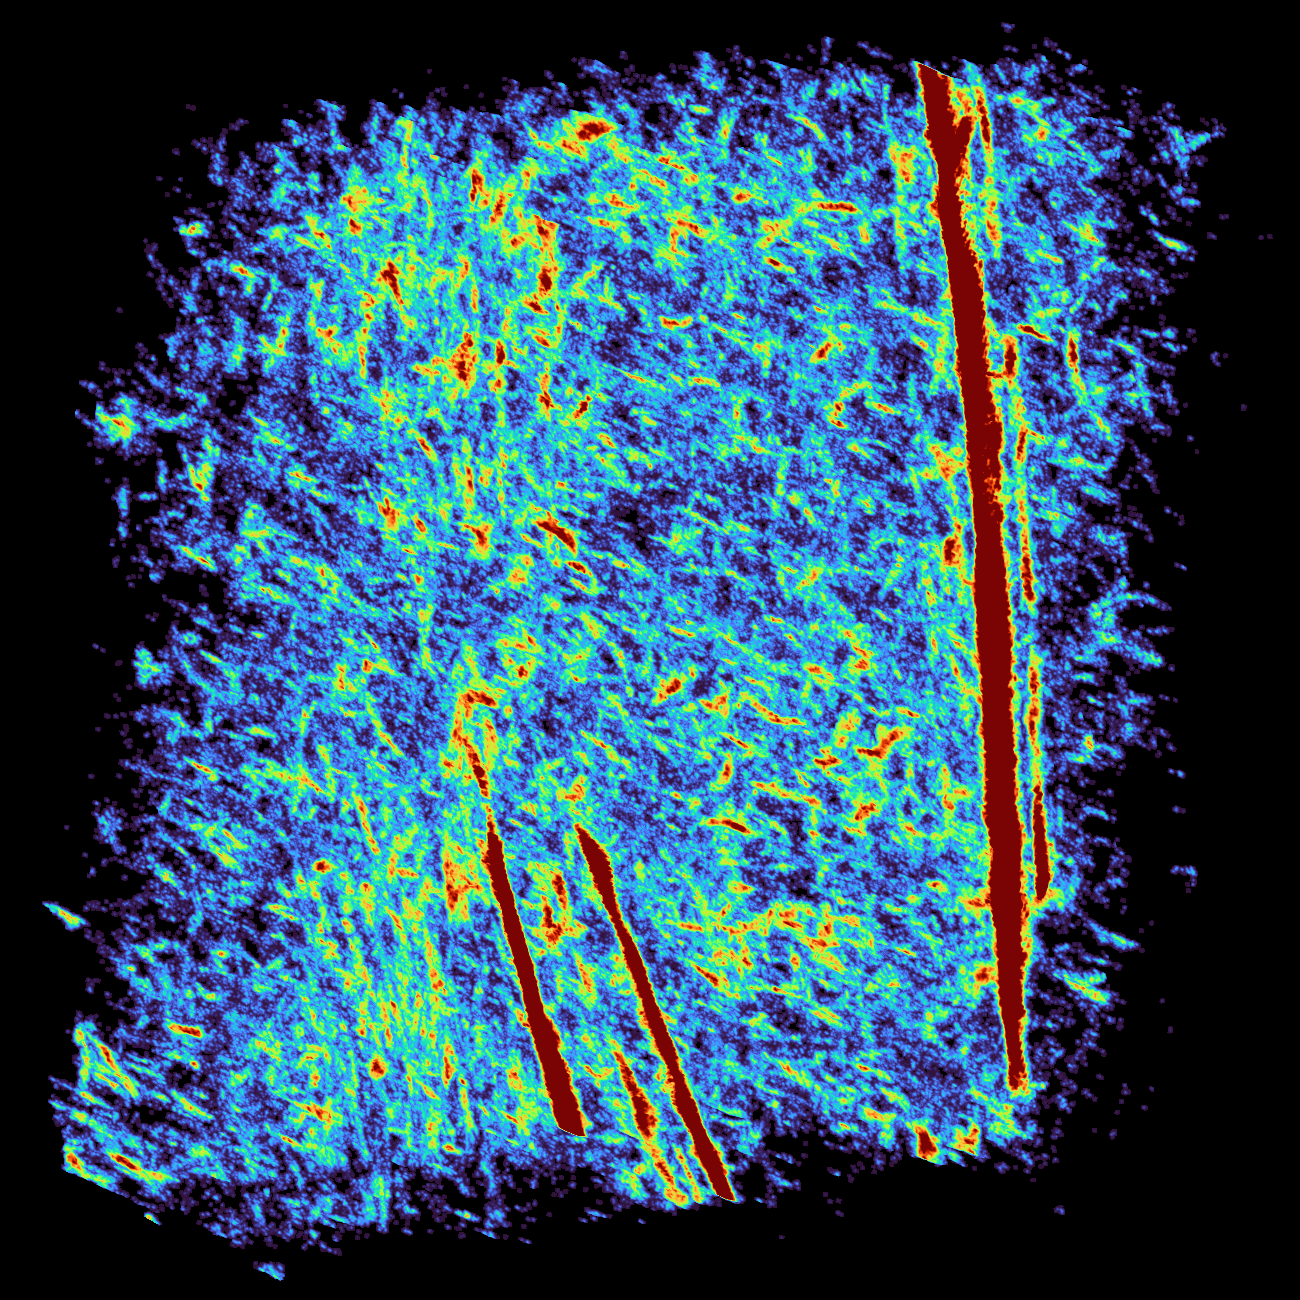
Open the scores map either in IMOD, Chimera(X) or napari. We recommend napari together with “turbo” color palette. In napari you can also open the tomogram, set the transparency of the scores map to 0.5 to directly see the correspondence between the strong peaks and features in the tomogram. By playing with the value range of the scores map, one can set the threshold for the peaks. Anything below this threshold will not be considered.
Following images show examples of slices from the scores_0_126.em map obtained in napari.
Particle extraction#
To obtain a particle list from the scores map you can use cryoCAT tmana
module
- the relevant function is scores_extract_particles. Note this has to be run from iPython or Jupyter notebook.
Particle extraction#
from cryocat import tmana
from cryocat import cryomap

# The scores and maps do not need to be loaded before running the function, i.e., one can
# specify the input path directly as a parameter in scores_extract_particles. However,
# in case you want to play with the parameters, it is recommended to load them first
# and then only run the extract function with different parameters.
scores = cryomap.read("./tm_outputs/scores_0_126.em")
angles = cryomap.read("./tm_outputs/angles_0_126.em")

tmana.scores_extract_particles(
    scores_map = scores,
    angles_map = angles,
    angles_list = "angles_5_c13.txt",
    tomo_id = 126,
    particle_diameter = 20,
    object_id=None,
    scores_threshold = 0.08,
    sigma_threshold=None,
    cluster_size=None,
    n_particles=None,
    output_path="particle_list.em",
    output_type="emmotl",
    angles_order="zxz",
    symmetry="c13",
    angles_numbering=0,
)